A year of solar data
Our solar array has been up and running for a year now. Since we have micro-inverters from Enphase, I'm able to log data every 5 minutes on how much solar power we're producing (you can browse a summary view of this data at Enphase's public page for our system). I've saved this data over the entire year (over 70,000 data points). Here are a few visualizations of the data. First, a simple contour map of the raw data - blue is 0-2000 watts, red is 2000-4000 watts, and green is more than 4000 watts of instantaneous power being produced by the array:
 This is the same data, but smoothed with a 5x5 box filter and viewed in perspective - it lets you see the longer weather events we've had (multi-day winter storms, extended summer cloudy intervals) - it gives the data an interesting "array of stacks" view:
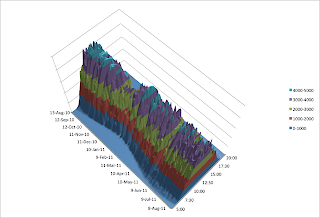
And here is a chart showing the average-per-time-of-day and maximum-per-time-of-day power production (note that in all these charts time-of-day has been corrected for daylight savings). The max is over 5 kilowatts, which is consistent with the design of the array. The average peaks around 3 kilowatts - and note that we very frequently have cloudy weather in the 2-3 hours after noon in Colorado. This shows up clearly in the average:

Over the past year, our array has produced 8.1 megawatt-hours of energy, averaging 20.8 kilowatt-hours per day. As expected, this is roughly 2/3 of our electric use. I'll see what other interesting data I can tease out of this in the coming weeks...


Comments